An Overview of Cycle Threshold Values and their Role in SARS-CoV-2 Real-Time PCR Test

Interpretation
September 17, 2020
Introduction
This document provides an overview of Ct values with a focus on how they are determined, their relationship to viral load, and how Ct values may contribute to the interpretation of positive rRT-PCR results among patients with low pretest probability. Key factors that contribute to test performance are also discussed, and guidance on investigating a possible false positive result is provided. Data generated at Public Health Ontario (PHO) Laboratory is also presented which demonstrates the impact pretest probability has on the positive predictive value (PPV) of a SARS-CoV-2 rRT-PCR laboratory test in the Ontario context.
Background
COVID-19 was first reported in Wuhan, China in December, 2019 and subsequently spread globally, with declaration of the pandemic in early March, 2020. This resulted in the rapid and widespread development and implementation of a plethora of tests and platforms for the detection of SARS-CoV-2, the virus responsible for this newly emerged disease. Testing has proven critical to the pandemic response with early detection and subsequent public health and clinical interventions based on testing as key to both patient and outbreak management. With advances in testing and technology so too have there been advances in understanding both the disease and its epidemiology. For example, through testing it has become apparent that persons may test positive (i.e., SARS-CoV-2 detected) without symptoms, including for those who are asymptomatic (i.e., never develop symptoms) or presymptomatic (i.e. later develop symptoms), or due to a false positive laboratory test.
The risk of false positive results increases as the pretest probability of COVID-19 decreases, such as in instances of low prevalence. Moreover, positive real-time reverse transcription (rRT)-PCR test results that are close to the limit of detection (LOD) of an assay have a greater likelihood of being false positives. One key explanation for this is that when specimens become contaminated with very low levels of test target during the laboratory testing process, it produces a high Ct positive result near the assay LOD. Nonspecific signals can also occur during later rounds of amplification that are misinterpreted as amplification due to presence of target in the specimen, also giving false positive results associated with high Ct values.
Accordingly, current guidance in Ontario recommends contacting the testing laboratory to discuss the test results and review the Ct when a positive result is reported for an asymptomatic patient with low pretest probability (i.e., no known high risk exposures).1 Clarification of the results within the epidemiological context may enable the discernment of true positives from false positives thereby informing appropriate public health follow up (e.g. case management, contact tracing and/or outbreak declaration). Asymptomatic low pretest probability detections have been identified during broad testing campaigns, such as periodic test-based surveillance of asymptomatic residents, staff and visitors of longterm care homes, in the absence of cases/outbreaks.
Understanding Ct values and their interpretation in the context of laboratory testing is of particular importance to public health practitioners, where test results contribute to the classification of persons as meeting (or not meeting) the provincial case definition and subsequent decisions regarding public health management, including contact tracing and/or outbreak declaration.1 There can also be important clinical scenarios where patients told they are positive for SARS-CoV-2 question where they may have been exposed, or may have a false sense of security for having been “previously positive”.
Methods
The Ontario COVID-9 Testing Technical Working Group includes microbiology representatives from a large number of SARS-CoV-2 testing laboratories from across Ontario. The group discusses topics of priority and shares experiences related to SARS-CoV-2 testing.
It became apparent that there was a need to provide stakeholders with additional information to help healthcare providers understand some key areas around interpretation of rRT-PCR testing, in particular the application of cycle threshold (Ct) values to test interpretation. The Working Group identified the need for a guidelines document to cover some key topics in this area, and together agreed on the topics to be included. PHO Laboratory also provided laboratory data from a study that has been conducted to help understand the impact that pre-test probability of a patient having COVID-19 has on PPV of rRTPCR test results.
The document initial draft was prepared by PHO Laboratory and shared with the other Working Group members, as well as other PHO stakeholders, for input prior to finalization and posting.
Important Questions and Information to Consider
1. What is the cycle threshold (Ct) value?
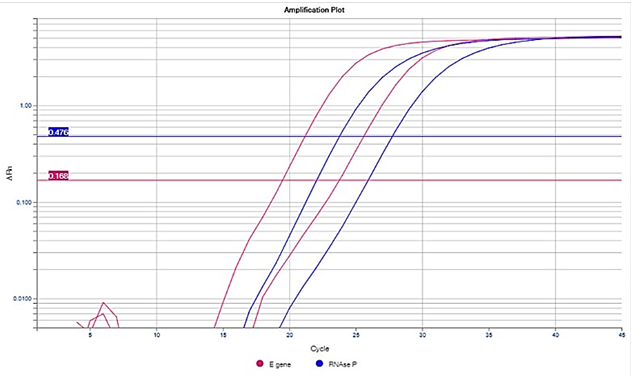
The Ct value is defined as the number of cycles of amplification (using rRT-PCR) required for the fluorescence of a PCR product (i.e. the target/amplicon) to be detected crossing a threshold, which is above the background signal (a low level signal that is present in the assay regardless of whether target is present). When rRT-PCR is performed, a predetermined number of cycles (rounds) of amplification of target (e.g. SARS-CoV-2) nucleic acid occur. If target is present in the specimen then each round of amplification results in a doubling of the amount of target present. As a result, amplification occurs exponentially, producing an exponential curve of amplification (Figure 1). This exponential amplification is visualized by the use of a fluorescent nucleic acid probe. Probes are fluorescently labelled DNA oligonucleotides, which bind to the target. As amplification proceeds, more target becomes available for binding by the fluorescent probe, increasing the fluorescent signal. In general, the amount of fluorescent signal observed increases as amplification proceeds and is proportional to the amount of target present in the specimen.
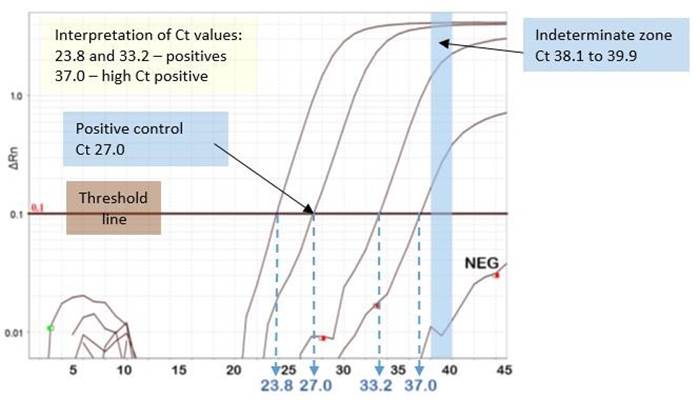
Amplification is considered significant, and equates with ‘detection’ of target, if the threshold of fluorescence is reached (see horizontal brown line in Figure 1). The threshold of fluorescence is usually set at the midpoint of the exponential phase of amplification of the positive control included in the assay run.
The positive control is typically a previously characterised positive clinical specimen, inactivated virus culture, or viral nucleic acid. If positive control material is limited, synthetic RNA sequence, identical to the target region of the virus, is used as an alternative.
A vertical line (see blue dashed lines in Figure 1) is orthogonally dropped from the point where the amplification curve crosses the threshold to where it meets the X axis of the graph, corresponding to the Ct value. The Ct value is essentially the number cycles of doubling amplification at which target detection has occurred.
Figure 1: An Example of a Real-Time PCR Amplification Curve
Note: This amplification curve is presented on a logarithmic scale. Curves can also be viewed on a linear scale, which will look different but does not change the Ct interpretation. Not all commercial real-time PCR assays provide Ct values or amplification curves for viewing by the user. In addition, some molecular assays are based on other technologies (e.g. flow cytometry), and hence, do not provide Ct values.
2. How are Ct cut-off values interpreted for detected, indeterminate and not detected results?
During assay development and validation, the limit of detection (LOD) is determined using a target of known quantity which is serially diluted, usually using 1 log (i.e., 10 fold) dilutions, and tested with the PCR assay. The cut-off (highest Ct value) for positivity is usually placed at a Ct value similar to that generated by the lowest copies of target that can be reliably detected in the assay (e.g. Ct ≤ 38). This Ct cut-off value is determined by manufacturers of commercial assays, or by laboratories during the validation of laboratory developed tests (LDTs). In some commercial assays, the cut-off is determined individually for each run based on the amplification curve and Ct value of the positive control.
A negative cut-off is assigned to the Ct value at which target is no longer expected to be detected based on the LOD determinations (e.g. Ct ≥40).
Some assays include an indeterminate zone, the Ct range of which falls between the cut-offs for detected and not detected results (e.g. Ct 38.1 to 39.9 for the PHO LDT). Indeterminate results are those Ct values which fall between the cut-offs for detected and not detected results later in the amplification process. This may be due to low quantity of viral target in the clinical specimen that is at or near the LOD
of the assay, or it may represent nonspecific reactivity (false signal) in the specimen. When clinically relevant, indeterminate results should be investigated further by retesting for a different gene target using a validated real-time PCR assay that is equally or more sensitive than the initial assay or method used. Alternatively, nucleic acid sequencing of the amplified target may be performed. Figure 1 shows a light blue bar that outlines the range of Ct values PHO Laboratory employs (Ct 38.1 to 39.9) to designate a result as indeterminate when the amplification curve crosses the threshold line within this pre-set range.
3. Do Ct values correspond to the quantity of target present in a specimen?
Most rRT-PCRs are qualitative (i.e. target is detected or not detected with no target copy number reported), not quantitative (target copy number per unit volume of specimen matrix or per reaction is reported). In isolation, Ct values provide a relative measure of viral quantity in the specimen, but do not provide the actual quantity. The Ct value can potentially provide a measure of viral copies if standards of different known quantities are included in the same run and tested in parallel to the clinical specimens. The Ct value(s) at a given quantity of the standard is then used to extrapolate the quantity of virus in the specimen from the Ct value generated when tested. The use of standards and quantification adds more complexity to a rRT-PCR assay and requires appropriate reference materials. Each round of PCR doubles the amount of target in the reaction. Based on this, it can be extrapolated that each 3.3 increase in Ct value correlates with approximately 1 log (i.e., 10 fold) less target in the primary clinical specimen undergoing the PCR reaction.
Quantitative PCR assays are predominantly used in circumstances whereby they inform clinical (e.g., treatment) or public health (e.g., contact tracing) management, such as antiviral therapy for some blood-borne viruses (e.g. HIV, cytomegalovirus and hepatitis viruses). Blood-borne viruses are more amenable to being measured quantitatively, because blood is a more standardized specimen type. When respiratory specimens are tested, there is much more variability, which can affect the result and is unrelated to the actual quantity present in the specimen. This includes the type of swab used for collection, the transport media, the method and quality of specimen collection, the PCR assay, and the way that the threshold line is set for each run (predetermined, de novo, by a human, or by software, etc.). In addition, viral shedding in respiratory secretions can be variable over time.
Ct values obtained from PCR testing performed on consecutive specimens collected on the same patient, run using the same assay, in the same testing laboratory, could be compared to give a relative indication of the quantity of virus in the different specimens. However, as outlined above, they do not indicate the actual quantity of virus in the sample.
Several studies have been conducted in an attempt to correlate Ct values with infectivity of SARS-CoV-2 virus. For example, viability of virus can be determined by inoculating cell lines in culture and assessing for evidence of viral replication. This is a laborious process, which can only be performed in a Containment Level 3 (CL3) laboratory. It is not currently standardized and cannot be used to guide clinical decisions. Critically, it has not been established that persons with PCR-positive specimens that cannot be cultured are not infectious. This is particularly important as in some laboratories it has been relatively difficult to culture SARS-CoV-2 compared to other viruses.
For example, a study in which virus culture was performed at Canada’s National Microbiology
Laboratory (NML) documented that specimens with Ct values > 24 were viral culture negative.2
However, the US CDC has reported that they were able to culture virus from specimens with Ct values up to the low 30s (unpublished data).3 It is important to note that each of these laboratories (NML and CDC) used different real-time PCR assays in their evaluations. A SARS-CoV-2 proficiency testing panel was distributed to 26 different SARS-CoV-2 testing laboratories in Ontario in April 2020 by The Institute of Quality Management in Healthcare (IQMH), the organization that administers the Quality
Management Program for laboratory services in Ontario. Variability of Ct values of up to 8 cycles were observed for the same specimen material tested across the participating laboratories. These different findings reinforce that it is inappropriate to compare Ct values from different assays, and to extrapolate Ct cut-offs for virus viability from one laboratory to any other laboratory and that Ct cut-offs cannot be reliably used for the determination of virus viability. The US CDC applies these principles to advise that the correlation presented between Ct values and the ability to recover replication-competent virus is only applicable to upper respiratory specimens tested at their laboratory. Further, the relationship between the ability to grow a virus in culture (viral replication) in a laboratory and infectivity to humans is not currently known.
Some experts have argued that Ct values should be provided routinely on laboratory reports to assist with clinical and public health decision making.4 This may be applicable in a limited setting where healthcare providers only receive reports from a single laboratory, and can be educated about the test performance and Ct value characteristics of a particular assay. However, in complex laboratory network environments, such as in Ontario, where specimens may be tested at one of several laboratories (> 40 laboratories conducting SARS-CoV-2 rRT-PCR in the province on a variety of different extraction and PCR platforms), utility of such reporting is questionable. Moreover, test results are received and reviewed by a myriad of healthcare providers, as well as patients, with varying understanding of Ct values. As such, the inclusion of Ct values on laboratory reports issued in Ontario (and Canada) is not recommended – they are of limited utility if used in isolation when interpreting the rRT-PCR result. In the rare, specific scenarios where it is thought that the Ct value might inform clinical or public health management, clinical and public health providers should contact the testing laboratory to discuss Ct interpretation, in the context of the epidemiology and clinical scenario, with the microbiology team.
4. How common are false positive COVID-19 tests? What is the cause of false positive results and how might this be minimized?
Based on PHO Laboratory data, the rate of false positive tests that are later determined to be negative requiring results to be corrected is extremely low. How commonly this occurs in the province is not known, as individual reports that are corrected are not centrally documented. In Ontario, incidents of a significant number of specimens (as determined by the testing laboratory) with false positive results are notified to the Laboratories and Genetics Branch of the Ministry of Health, and to IQMH.
As of August 15, 2020, PHO Laboratory detected possible false positive SARS-CoV-2 results on approximately 30 occasions among over 850,000 specimens tested for COVID-19, with ~17,500 (approximately 2%) specimens testing positive. This represents a false positivity rate of less than 0.01%
(specificity of >99.99%), which is well beyond performance targets for a laboratory test, even acknowledging there are likely to be some false positive tests that go undetected.
In general, the positive predictive value (PPV) of COVID-19 PCR assays is excellent among patients with high pretest probability, and approaches 100%. This was determined at PHO Laboratory, using viral sequencing of PCR-positive specimens, excluding those for which viral copy number was near the LOD of the assay.
However, in the context of low prevalence when the virus is not circulating at a high level in the community, PPV drops significantly. For example, if the community prevalence of SARS-CoV-2 is 1%, with a test sensitivity of 80%, and specificity of 99%, the PPV of a positive test is only 44.7%. If prevalence increases to 5% or 10%, then the PPV increases significantly to 80.8% and 89.9%, respectively. A recent serosurvey by PHO using residual convenience specimens found a low adjusted seroprevalence of 1.1% (95% CI 0.8, 1.3) in June.5 This supports that Ontario is currently a low prevalence setting for SARS-CoV-2 infection.
False positive results can occur at various stages of laboratory testing, and can be grouped into the following categories:
1. Pre-analytical errors. These are errors that occur prior to the actual testing and include issues such as mislabelling of specimens, resulting in incorrect results being reported. These errors may also result from specimen contamination at time of collection, in transport, or during aliquoting in the laboratory.
2. Analytical errors. These occur during the laboratory testing process. These include, for example, errors related to reagent contamination. Reagents can arrive contaminated from the supplier. To mitigate this, each new lot of reagents undergoes a quality assurance check before being put into use. False positive results can also arise from contamination due to pipetting errors, which can be due to human error or defects in automated equipment. Such analytic errors are controlled through the use of negative and positive controls on each run of the assay, which are reviewed prior to releasing results.
3. Post-analytical errors. These errors occur at the stage of test result interpretation and reporting of results. Incorrect interpretation of amplification curves could lead to a false positive result. Transcription errors may also result in false positive results being generated. Such errors are mitigated by ensuring all results and interpretations are reviewed prior to reporting.
5. What steps can be taken to investigate a positive result for an asymptomatic patient with low pretest probability and re-positive results?
It is notable that true false positive SARS-CoV-2 PCR test results in Ontario are rare. In most cases, a positive result represents COVID-19 infection irrespective of the presence of symptoms or known risk factors. This veracity of the result is distinct from the assessment of the public health measures recommended for the asymptomatic person with the positive result and their contacts. During investigation, any individuals with positive results should be treated as infectious and be isolated until cleared by the local public health unit.1 Contacts should be identified, but do not necessarily have to quarantine while further investigating the positive result. For further information, health care providers should contact their local public health unit.6
To investigate a possible false positive result in an asymptomatic patient with low pretest probability (i.e., no contact with a confirmed case of COVID-19, other high risk exposure, or known higher levels of circulation of virus in the community), several steps can be taken. These include:
1. Review the clinical history, in particular symptoms or clinical findings compatible with COVID-
19, or contact with a confirmed case of COVID-19, or other exposure.7 If symptoms or
epidemiological risk factors are elucidated, then pretest probability is not low, and the likelihood of a false positive result declines significantly. See Case Study below. In the context of higher levels of community transmission, the pretest probability may not be low, even with no symptoms or specific epidemiological risk exposures.
2. If the assay used consists of more than one target, and more than one target is detected, this suggests a higher viral load in the sample. Specimens with higher relative viral load, with multiple targets detected, are less likely to be false positive results.
3. Contact the testing laboratory to determine if systemic technical issues have occurred, or are occurring, which may impact testing, potentially resulting in a false positive test.
4. In general, specimens with Ct values well below the assay cut-off for positivity (e.g. Ct < 35 with the laboratory positivity cut-off for that assay set at Ct = 38) are less likely to be false positive. If in doubt, contact the testing laboratory to have the Ct value and report reviewed (provided the assay in use generates a Ct value). The amplification curve may also be reassessed to ensure no interpretive errors were made at the time of reporting. See Figure 1 for an example of a good amplification curve in a high Ct positive specimen.
5. Current public health guidance recommends asymptomatic patients with low pretest probability have a repeat test right away.1 If the repeat test is positive, this would contribute to the evidence supporting a true positive. However, if the initial positive result was of high Ct value, near the assay cut-off, a repeat collection will typically be negative due either to lower viral shedding over time and/or inconsistent assay performance for specimens at or near the cut off. A negative retest does not necessarily indicate the first test was a false positive. However, the follow-up negative test may provide additional context to the public health management of the individual and whether contact management is warranted.
6. Consider requesting that the specimen be retested on the same assay and/or a different assay if this is available to the testing laboratory. If the result can be reproduced this would increase the likelihood that the result is true positive. However, a negative result on retesting does not necessarily mean the initial testing was incorrect, as assay performance near the LOD is not consistent, with varying results on repeat testing. In addition, different assays will perform differently on the same specimen with virus quantity near the LOD.
While the above steps are being taken, it is important to treat the patient as positive for COVID-19 and ensure that appropriate infection prevention and control and public health measures are in place.
RE-POSITIVE RESULTS
Ongoing detection of positive results after clearance from isolation, either by time-based or test-based clearance, is now a well-established phenomenon, and such cases are referred to as re-positive.8 In general, repeat testing in someone who has been previously positive is not recommended unless clinically indicated.9 However, given the limited evidence on immunity and the emerging evidence on risk of true re-infection, re-positive results in a patient who is symptomatic and/or had a recent high risk of exposure to a case may cause concern for whether a repeat positive result may represent reinfection. To investigate whether a re-positive result is more likely to be ongoing detection from an original infection episode or a true new re-infection, the Ct value and number of targets detected may be helpful additions to the clinical context, and whether additional public health follow-up is necessary for a true re-infection. A re-positive value with lower Ct value (e.g., <32) would be required to conduct further analysis, such as viral genetic sequencing, to determine similarity to the original specimen or other cases that the re-positive individual was exposed to before the re-positive result.
6. Case Study: Impact of pretest probability on positive predictive value (PPV).
When considering the possibility that a positive result may be false positive, the pretest probability is an important factor to consider. PHO Laboratory conducted a limited evaluation among patients with high Ct positive specimens (Ct ≥35) using a laboratory developed or commercial assay targeting the E gene. PCR and sequencing of a second, independent target (RNA dependent RNA polymerase; RdRp) demonstrated differing proportions of detection depending on the pretest probability.
In brief, among convenience-selected specimens from 103 patients tested at PHO Laboratory with Ct values ≥ 35 included in the study, virus was confirmed by RdRp PCR and sequencing as follows
• 18 (78%) of 23 patients previously confirmed to be SARS-CoV-2 positive on an earlier specimen collected.
• 17 (85%) of 20 patients who were symptomatic at the time of testing.
• 10 (67%) of 15 asymptomatic patients who were close contacts of confirmed COVID-19 cases.
• 16 (50%) of 32 of asymptomatic patients who were tested as part of an outbreak within an institution with ≥10 confirmed cases.
• 5 (16%) of 32 asymptomatic patients who were tested as part of an outbreak or for surveillance purposes, within an institution where only 1 to 3 patients were SARS-CoV-2positive (all asymptomatic).
See Tables 1A and 1B, located in the Appendix for more information on the above analysis.
Notably, specimens from patients that were asymptomatic and had no epidemiological links to COVID19 cases had the lowest proportion of specimens confirmed by RdRp sequencing (5/32, 16% confirmed), which was significantly lower than that for asymptomatic patients tested with epidemiological links to multiple confirmed cases (16/32, 50% confirmed; Fisher’s Exact p= 0.007). This suggests that a high Ct positive result is more likely to be false positive when observed in an asymptomatic patient with no epidemiological links to cases during low community prevalence of disease. However, it is difficult to know exactly which patients among this subgroup are true positive versus false positive, as we know that not all true positive high Ct positive specimens are repeat positive when retested on the same or a different platform. Ct values in the absence of detailed clinical and epidemiological data cannot identify false positive results and their utility is limited to be supportive of investigating suspected false positive results in the right clinical context.
Ontario’s Ministry of Health has provided guidance on Management of Cases and Contacts of COVID–19 which allow for reduced public health action when a positive result in an asymptomatic low pretest probability patient is immediately followed by a negative test on a new specimen.1 This approach reduces the need to fully clarify if all such tests are true positive versus false positive, which is often very difficult to determine at the individual test level unless there are systemic technical laboratory issues occurring that are identified, or the specimen can be confirmed as positive with an independent assay. Additionally, in the context of emerging evidence on immunity and re-infection, determination of whether an individual truly was or was not infected does not impact their recommendations for maintaining public health measures to prevent a potential future infection.
Conclusions
The COVID-19 pandemic has led to large scale testing of asymptomatic persons with low pretest probability, a practice not previously employed for any respiratory viral pathogen. SARS-CoV-2 Ct values may be of use when interpreting positive laboratory results derived from patients with low pretest probability, in particular, asymptomatic persons with no epidemiological link to a confirmed COVID-19 case. The province of Ontario has produced guidance documents that facilitate risk-based patient management and follow up that do not rely on definitively concluding that a test is a true or false positive. Ongoing education regarding the increased possibility for false positive test results when testing high numbers of asymptomatic persons during periods of low community prevalence of SARSCoV-2, even when utilizing assays with excellent performance is required. This would benefit the healthcare community and potentially avoid unnecessary patient isolation, contact tracing and outbreak declaration.
References
1. Ontario. Ministry of Health. Management of cases and contacts of COVID-19 in Ontario [Internet]. Version 8.0. Toronto, ON: Queen’s Printer for Ontario; 2020 [modified 2020 Jun 23; cited 2020 Aug 21]. Available from:
health.gov.on.ca/en/pro/programs/publichealth/coronavirus/docs/contact_mngmt/management_ca ses_contacts.pdf
2. Bullard J, Dust K, Funk D, Strong JE, Alexander D, Garnett L, et al. Predicting infectious SARS-CoV-2 from diagnostic samples. Clin Infect Dis. 2020 May 22 [Epub ahead of print]. Available from: doi.org/10.1093/cid/ciaa638
3. Centers for Disease Control and Prevention (CDC). Duration of isolation and precautions for adults with COVID-19 [Internet]. Atlanta, GA: Centers for Disease Control and Prevention; 2020 [modified
2020 Aug 16; cited 2020 Aug 21]. Available from: cdc.gov/coronavirus/2019ncov/community/strategy–discontinue–isolation.html
4. Tom MR, Mina MJ. To interpret the SARS-CoV-2 test, consider the cycle threshold value. Clin Infect Dis. 2020 May 21 [Epub ahead of print]. Available from: doi.org/10.1093/cid/ciaa619
5. Ontario Agency for Health Protection and Promotion (Public Health Ontario). COVID-19
Serosurveillance summary: COVID-19 Seroprevalence in Ontario: March 27, 2020 to June 30, 2020 [Internet]. Toronto, ON: Queen’s Printer for Ontario; 2020 [cited 2020 Aug 21]. Available from: publichealthontario.ca/–/media/documents/ncov/epi/2020/07/covid–19–epi–seroprevalence–inontario.pdf?la=en
6. Ontario. Ministry of Health, Ministry of Long-Term Care. Health services in your community: public health units [Internet]. Toronto, ON: Queen’s Printer for Ontario; 2019 [modified 2020 May 06; cited
2020 Aug 25]. Available from: health.gov.on.ca/en/common/system/services/phu/locations.aspx
7. Ontario. Ministry of Health. COVID-19 reference document for symptoms [Internet]. Version 6.0. Toronto, ON: Queen’s Printer for Ontario; 2020 [modified 2020 Aug 06; cited 2020 Aug 22]. Available from: health.gov.on.ca/en/pro/programs/publichealth/coronavirus/docs/2019_reference_doc_symptoms. pdf
8. Ontario Agency for Health Protection and Promotion (Public Health Ontario). Focus on: COVID-19:
ongoing viral detection and repeat positives [Internet]. Toronto, ON: Queen’s Printer for Ontario;
2020 [cited 2020 Aug 28]. Available from: https://www.publichealthontario.ca//media/documents/ncov/main/2020/06/covid–19–ongoing–viral–detection–repeatpositives.pdf?la=en
9. Ontario. Ministry of Health. COVID-19 quick reference public health guidance on testing and clearance [Internet]. Version 9.0. Toronto, ON: Queen’s Printer for Ontario; 2020 [modified 2020 Jul 29; cited 2020 Aug 28]. Available from:
health.gov.on.ca/en/pro/programs/publichealth/coronavirus/docs/2019_testing_clearing_cases_gui dance.pdf
Appendix: High cycle threshold case study category descriptions, definitions and data tables
Table 1A: High cycle threshold case study patient categories and definitions
|
CATEGORY |
DEFINITION |
Control group – persons who initially tested
Control group: second sample (high Ct) from positive with a low Ct value (Ct <30) and had a previously positive specimen (low Ct) subsequent test with a high Ct value (Ct ≥35)
Having a positive test with high Ct value (Ct ≥35)
Symptomatic with high Ct and at least one symptom as noted in the PHO LIS
Indicated as asymptomatic in the PHO LIS. Tested
Asymptomatic: Exposure to probable or due to exposure to probable or confirmed case OR confirmed case* residing at same address as another positive case
Indicated as asymptomatic in the PHO LIS and
Asymptomatic: Facility with ≥10 positive tested as part of an outbreak with at least 10 cases
positive cases
Tested as part of an outbreak or surveillance
 Asymptomatic: Facility with institution-wide testing investigation having 3 or fewer screening, with ≤3 positive cases, all asymptomatic positive tests and no symptomatic asymptomatic. positive cases in PHO LIS
PHO LIS = Public Health Ontario Laboratory Information System
*Note – this category contains specimens from institutional outbreaks (as well as non-outbreaks), and thus some specimens could also be classified in the “facility 10+ positive category”
Table 1B: Summary of high Cycle Threshold case study results: Initial E gene real-time PCR and RdRp PCR results, stratified by patient category
|
|
PATIENTS |
DETECTED BY RdRp PCR |
NOT DETECTED BY |
RdRp PCR |
Median Ct (Range) Median Ct (Range) Median Ct (Range)
Median Age
Category N on initial E gene N (%) on initial E gene N (%) on initial E gene
(Range)
PCR PCR PCR
|
Control group – persons who initially tested positive with a low Ct value (Ct <30) and had a subsequent test with a high Ct value (Ct ≥35)* |
23 |
52 (14-99) |
36.9 (35.0-38.4) |
18 (78.3) |
36.7 (35.0-38.3) |
5 (21.7) |
38.1 (35.9-38.4) |
|
Symptomatic with high Ct (≥35) |
20 |
68.5 (26-94) |
36.6 (35.0-38.3) |
17 (85.0) |
36.9 (35.03-38.3) |
3 (15.0) |
36.3 (35.6-37.4) |
|
Asymptomatic: Exposure to probable or confirmed case |
15 |
38 (10-93) |
36.1 (35.4-38.0) |
10 (66.7) |
36.0 (35.4-37.2) |
5 (33.3) |
37.5 (36.0-38.0) |
|
Asymptomatic: Facility with ≥10 32 positive cases |
57.5 (15-97) |
37.5 (35.4-40.6) |
16 (50.0) |
36.6 (35.4-40.6) |
16 (50.0) |
37.7 (35.5-38.3) |
|
|
Asymptomatic: Facility with institution-wide screening, with ≤3 positive cases, all asymptomatic. |
32 |
46 (17-95) |
36.9 (35.2-39.8) |
5 (15.6) |
36.2 (35.6-37.5) |
27 (84.3) |
37.0 (35.2-39.8) |
|
Total |
122 |
53.5 (10-99) |
36.9 (35.0-40.6) |
66 (54.1) |
36.2 (35.0-40.6) |
56 (45.9) |
37.5 (35.2-39.8) |
Ct = cycle threshold; E = envelope gene real-time Reverse-Transcription PCR; RdRp = RNA dependent RNA polymerase gene endpoint PCR with Sanger sequencing confirmation) * 20 patients were symptomatic, 2 were asymptomatic at time of first test, and 1 did not have symptom information available at time of first test
An Overview of Cycle Threshold Values
and their Role in SARS-CoV-2 Real-Time PCR Test Interpretation 13
Authors
Public Health Ontario
The Ontario COVID-19 Testing Technical Working Group
Citation
Ontario Agency for Health Protection and Promotion (Public Health Ontario). Focus on: an overview of cycle threshold values and their role in SARS-Cov-2 real-time PCR test interpretation. Toronto, ON: Queen’s Printer for Ontario; 2020.
©Queen’s Printer for Ontario, 2020
Disclaimer
This document was developed by Public Health Ontario (PHO) and The Ontario COVID-9 Testing Technical Working Group. PHO provides scientific and technical advice to Ontario’s government, public health organizations and health care providers. PHO’s work is guided by the current best available evidence at the time of publication.
This document may be reproduced without permission for non-commercial purposes only and provided that appropriate credit is given to PHO. No changes and/or modifications may be made to this document without express permission written from PHO.
Public Health Ontario
Public Health Ontario is an agency of the Government of Ontario dedicated to protecting and promoting the health of all Ontarians and reducing inequities in health. Public Health Ontario links public health practitioners, front-line health workers and researchers to the best scientific intelligence and knowledge from around the world.
Public Health Ontario provides expert scientific and technical support to government, local public health units and health care providers relating to the following:
• communicable and infectious diseases
• infection prevention and control
• environmental and occupational health
• emergency preparedness
• health promotion, chronic disease and injury prevention
• public health laboratory services
Public Health Ontario’s work also includes surveillance, epidemiology, research, professional development and knowledge services. For more information about PHO, visit: publichealthontario.ca.

An Overview of Cycle Threshold Values
and their Role in SARS-CoV-2 Real-Time PCR Test Interpretation 14